This blog was written for the RSA Blog Student Summer Series that will highlight graduate student success in regional studies across the globe throughout the summer.
In the era of globalization, innovative development and the artificial intelligence revolution have transformed the global economy. Economists have long viewed technological progress and innovation as dominant economic development and wealth drivers. Globally, Knowledge and Technology-Intensive (KTI) industries invest the most significant shares of their output in research and development (R&D)— contributing 11% to global GDP ($9.2 trillion) in 2019 (National Science Foundation, 2022). In the United States, KTI industries are the principal force behind the nation’s research and development (R&D) enterprises.

What comprises Knowledge and technology-intensive industries?
The KTI industries include IT and software publishing, scientific research and development, air and spacecraft, pharmaceuticals, computer, electronic and optical products, motor vehicles, medical and dental instruments, railroad, chemicals, and electrical industries. The classification of KTI industries was internationally recognized in an Organization for Economic Co-operation and Development (OECD) 2016 report based on R&D intensity. The R&D intensity implies the ratio of an industry’s business R&D expenditures to its value-added output.

Why India?
With the advent of Information and Communication Technologies (ICTs) and the increasing interconnectivity of the internet, the dispersion of knowledge in emerging countries like India does not remain a barrier anymore. In his famous book “The World Is Flat: A Brief History of the Twenty-First Century, ” Thomas Friedman mentioned that the economic playing field was levelling out for India by giving the example of the Bangalore IT cluster. India is one of the world’s largest functioning democracies, with a critical mass of English-speaking knowledge workers and free-market economic institutions. Besides, India has developed a broad and diversified Information and Communication Technology (ICT) infrastructure in recent years, reflecting its advantageous position. It contemplates that India can mobilize the benefits of the digital and knowledge revolution to enhance its economic performance. In the case of India, value-added by KTI industries increased from $34.5 billion in 2003 to $ 209.2 billion in 2018. Also, India’s gross domestic expenditure on R&D (GERD) as a percentage of GDP decreased from 0.77 % in 2000 to 0.66% in 2018. It implies that India has ample opportunity to invest in R&D activities to harness the full potential of India’s demographic dividend advantage. This motivates us to visualize the spatial concentration of workers in KTI industries across various districts of India using the Indian Economic Census (EC) data for 2013-14. The EC dataset is the only Indian dataset that permits the estimation of the complete establishment size distribution- across all sizes and types of establishments. Districts are the second subnational administrative units in India.

Methodology
Following Gastner and Newman’s diffusion-based method, we draw a cartogram map where each Indian district has its area in proportion to the total number of workers employed. Upon that, we shade each district according to the proportion of workers employed in KTI industries into five level hierarchy classified by the Jenks natural breaks method.
Our findings
Figure 1 shows that a high proportion of people working in the KTI industries are employed in Gurgaon and Bangalore city, shown in light purple. Gurgaon city comprises 22% of KTI industry workers in the Haryana state, while Bangalore city comprises around 29% in the Karnataka state of India. The following most concentrated cities depicted in light blues such as Pune, Chandigarh, Rangareddy, Mumbai Suburban, Haridwar, Ludhiana, Kancheepuram, and Thane, comprise 27 % of the total KTI industry’s workers.
In a nutshell, 25 major cities, as depicted in the map, comprise 54 % of the KTI industry’s workers, reflecting workers are spatially concentrated in only a few locations in India. This indicates that economic forces play a vital role in a specific location of a few districts that encourage other firms to locate their business near other firms. Therefore, Indian policymakers may benefit in targeting KTI industries in a particular location to enhance their competitiveness and economic output.
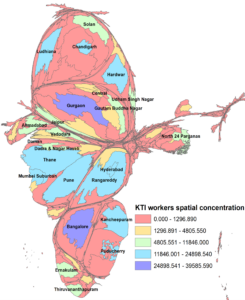
Figure 1. Cartogram of KTI industries workers’ concentration across various Indian districts.

Sugam Agarwal (sugam.agarwal06@gmail.com), a Doctoral Candidate at the Department of Humanities and Social Sciences, Indian Institute of Technology Ropar, India. He is currently works in the broader area of urban and spatial economics, focusing on the agglomeration of Indian manufacturing and service industries.

Dr. Smruti Ranjan Behera (smruti.ranjan@iitrpr.ac.in), an Associate Professor (Economics) at the Indian Institute of Technology Ropar, India. His research interests include agglomeration and urban economics, FDI and technology spillover, regional spillover, patent and innovation, open economy macroeconomics, applied econometrics, time series, panel data econometrics, etc.
Are you currently involved with regional research, policy, and development? The Regional Studies Association is accepting articles for their online blog. For more information, contact the Blog Editor at rsablog@regionalstudies.org.