Etienne Nel; University of Otago; Dunedin; New Zealand
RSA Membership Research Grant Holder
Introduction
Similar to the recent history of many OECD countries, Australia and New Zealand are experiencing the effects of significant population and economic change at the regional and local levels. Processes of selective rural depopulation and economic decline, the generally modest demographic and economic growth trends in the smaller and secondary centres and the stark reality of ‘shrinking towns’ exits in contrast with the significant growth of larger centres such as Brisbane, Wellington, Sydney and Auckland. This is occurring in the context of the significant ‘scaling back’ of the state which began in the 1980s, devolving, in many cases, the responsibility for managing change to local authorities, leaders and partnerships.
Demographic Change
The population of both Australia and New Zealand has grown significantly since census records started. In the case of New Zealand the population grew from 743 000 in 1896 to 4 242 048 in 2013, while in the case of Australia the population grew from 4 455 000 in 1911 to 22 340 024 in 2011.
In terms of where this growth is focussing, the large city bias in terms of both economic and population growth, particularly in Australia, is very well known, with the overwhelming bulk of the population living in the main coastal metropoles. The continued urban and large city bias in terms of where future growth will occur is evident in population projections. In New Zealand Auckland is expected to grow by 49% between 2013 and 2043, accounting for 62% of all projected population growth in the country. When combined with the other main cities, these centres account for 89% of all expected growth in the country. In Australia, while many smaller centres are not likely to experience significant growth and many will decline, Brisbane by contrast is expected to grow 48% between 2011 and 2031 and Perth by 77%.
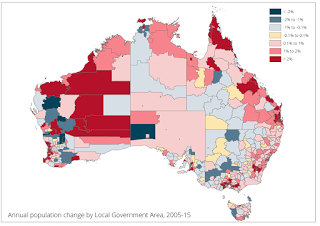
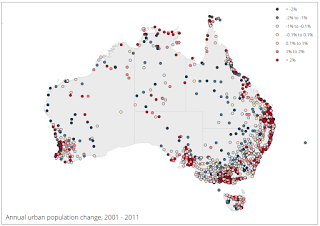
The urban and large city movement of the population, parallels the rationalisation of farming operations, the selective loss of functions from smaller service centres, in favour of the centralization of service functions in larger regional centres – the so-called sponge effect, and the frequent crises experienced in mono-economy towns – such as in timber, fishing and mining towns. In the case of Australia current exceptions include the recent, by probably short-term growth of mining towns in Western Australia and Queensland in particular. Figure 1 shows annualised population change in Australia’s local government areas between 2005 and 2015. The low and even negative growth of larger swathes of the country, with the exception of mining areas (especially in Western Australia) and the coastal metropoles is clearly evident. In Figure 2 annualised change in the urban centres is depicted which starkly reveals the same profile but equally significantly the lacklustre performance of many of the country’s inland towns.
Figure 1: Australia: Population change by local government area: 2005-2015.
Source: www.abs.gov.au
Figure 2: Australia: Annual Urban Population Change: 2001-2011.
Source: www.abs.gov.au
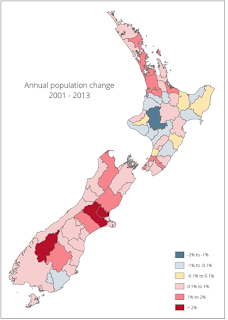
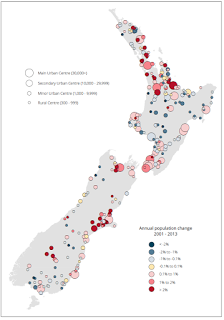
In the case of New Zealand broadly similar patterns are occurring, but with some significant differences. Figure 3 shows the annualised population change in New Zealand’s local government areas from 2001-2013. What is striking about this figure is the seeming reversal in the long term decline of most rural areas in the South island, which was the norm for nearly 100 years, as new farming activities, tourism, recreation and retirement, and growth in the Christchurch hinterland following 2011 earthquakes have reversed this trend. By contrast many of the North Island’s rural areas are experiencing population loss. In Figure 4 annualised population change in the various urban centres is depicted. In this Figure the town symbols are scaled according to size, and show the evident grow of larger centres and the frequent decline of many smaller centres, including in the South Island. In many instances these shrinking towns are former mono-economy centres – industrial, timber and mining centres or smaller services centres. 
Figure 3: New Zealand: Annualised population change according to local authority areas: 2001-2013
Source: www.stats.govt.nz

Figure 4: New Zealand: Annualised population change in the Urban Centres: 2001-2013.
Source: www.stats.govt.nz
In terms of urban growth and decline, census statics reveal the distinctive differences experienced between the different classes of settlement (see Table 1). While almost all the larger urban centres in Australia are growing – 116 out of the 118 larger settlements, in New Zealand nearly 20% of settlements in the two largest settlement categories are declining. Lower down the ranks, 40 % of the smaller centres in New Zealand and 28% in Australia are declining. In both countries, approximately 27% of local government areas are experiencing population loss.
Table 1: Urban Change by Size Category and Local Government Areas: New Zealand and Australia
|
NEW ZEALAND
1981-2013 |
|||
|
Category of Settlement |
No. in Class |
Number Growing |
% Growing |
|
Main Urban Areas
(+ 30 000) |
18 | 16 | 89 |
| Secondary Urban Areas (+10 000) | 15 | 9 | 53 |
|
Minor Urban Areas
(+10 00) |
100 | 60 | 60 |
| Rural Centres (- 1 000) | 138 | 69 | 50 |
| TOTAL | 271 | 153 | 56.5 |
| Local Govt Areas (2006-2013) | 68 | 50 | 73.5 |
|
Australia
1996-2011 |
|||
|
Urban Centres |
No. in Class |
Number Growing |
% Growing |
| Capitals | 8 | 8 | 100% |
| Significant Urban Areas (+ 10 000) | 110 | 108 | 98% |
|
Urban Centres
(+ 1 000) |
565 | 408 | 72% |
| TOTAL | 683 | 524 | 77% |
| Local Government Areas: 2005-2015 | 551 | 400 | 73% |
Source: www.stats.govt.nz ; www.abs.gov.au
Local and Regional Response
The preceding statistics and illustrative material clearly indicate the reality of significant regional and local divergence in both population trends, but also, by implication, economic well-being and growth potential. Both countries long-ceased to implement state strategies geared to address regional disparities and reliance on market forces is the norm. That said, at a Federal level in Australia there is legal provision to ensure equity in well-being and service provision across the country. In New Zealand, the largely self-funded nature of local government, potentially enhances the differences between stronger and weaker local government areas.
In Australia, local government affairs are largely a state matter, leading to not insignificant differences in levels of state policy and support for urban development and regional / rural issues. While support, particularly for smaller, declining centres is limited, policies in Western Australia are particularly interesting. The ‘Royalties for Regions’ programme has seen the investment of not insignificant revenues from the recent mining boom in that state back into non-metropolitan areas, with the ‘Supertowns’ programme seeking to support economic diversification and social provision in identified regional centres across the state. At the regional level a network of ‘Regional Development Agencies’ have been established across the country to serve as co-ordinating bodies, tasked to consult with communities, provide information and support informed regional planning. Typical interventions include developing economic strategies, supporting CBD renewal, investment attraction and responding to economic and demographic change.
In New Zealand aside, from government support for community development facilitators; various community development projects led by the Ministry of Social Development and selective support for industry and regional innovation, regional and local development tends to be a local / regional concern. The net result is significant variation in who takes the leadership role in promoting local and regional development. This can include comprehensive development interventions undertaken by Regional Development Agencies such as Venture Southland and Venture Taranaki, both of which undertake development on behalf of local government. Other responses include private sector led Regional Development Agencies such as in Tauranga and local interventions variously undertaken by local authorities or local partnerships groups. Project foci are wide-ranging and include efforts to cope with and encourage growth or to respond to population and economic loss. In areas experiencing decline, economic and social interventions have been undertaken to encourage rejuvenation, promote investment and training and encourage tourism, but they can seldom arrest or reverse long-term structural decline and population loss. Rather they can moderate the scale and its impact.
Conclusion
The significant demographic change which Australia and New Zealand are experiencing is reflected in selected patterns of growth and change, which in turn generally mirror patterns of economic change. Government, regional and local responses reflect state and local variations and the relevance of analytical lenses which seek to better understand institutional change and evolving economic geography.
Sources:
Australian Bureau of Statistics: www.abs.gov.au
Beer, A. and Lester, L. (2015) Institutional thickness and institutional effectiveness: developing regional indices for policy and practice in Australia, Regional Studies, Regional Science, 2, 1, 205-228.
Eaqub, S. (2014) Growing Apart: Regional prosperity in New Zealand, BWB Texts: Wellington.
Nel, E.L., Recent trends in regional demographic and economic inequality in New Zealand and associated regional development implications, Local Economy, 30, 1, 12-20.
Paul, V. and Haslam MacKenzie, F. (2015) About time the regions were recognised: interpreting regional building in Western Australia, Australian Geographer, 46, 3, 363-388.
Statistics New Zealand: www.stats.govt.nz